
Valiotti Analytics specializes in crafting tailored data architectures for mobile and digital startups across various sectors including EdTech, FinTech, SaaS, eCommerce, GameDev, and Mobile.
With over 5 years of experience and 40+ successful projects, we cater to industry leaders, SMBs/SMEs, and startups alike. Our expertise spans a diverse range of tools including AWS, Google Cloud, Snowflake, PostgreSQL, ClickHouse, Google BigQuery, Metabase, Tableau, Redash, and more.
Focus Areas
Service Focus
- Big Data & BI
Industry Focus
- Education
- Advertising & Marketing
- Financial & Payments
Valiotti Analytics Clients & Portfolios
Key Clients
- Worldcoin
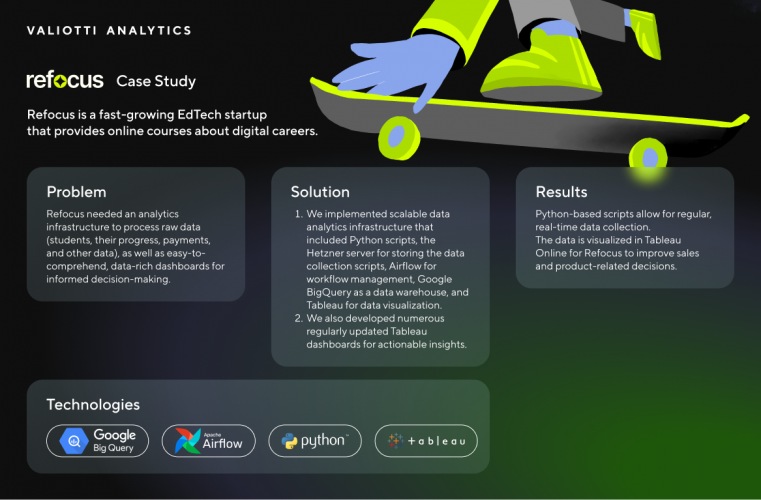
- Refocus
- Mentorshow
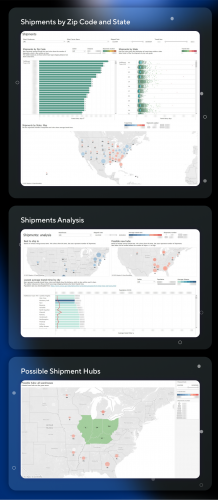
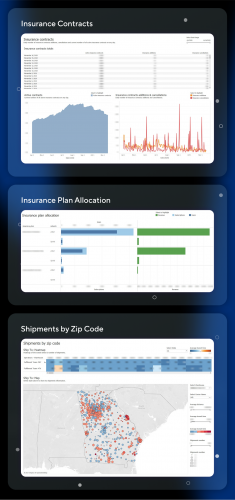
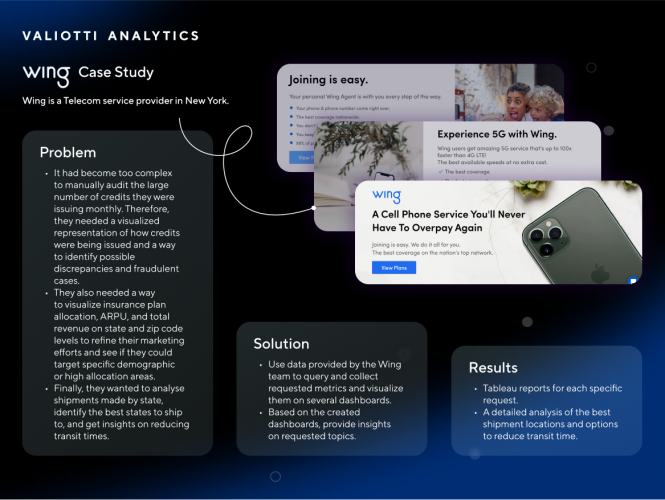
- Wing
- SkyCoach
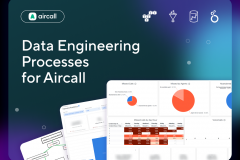
- Aircall
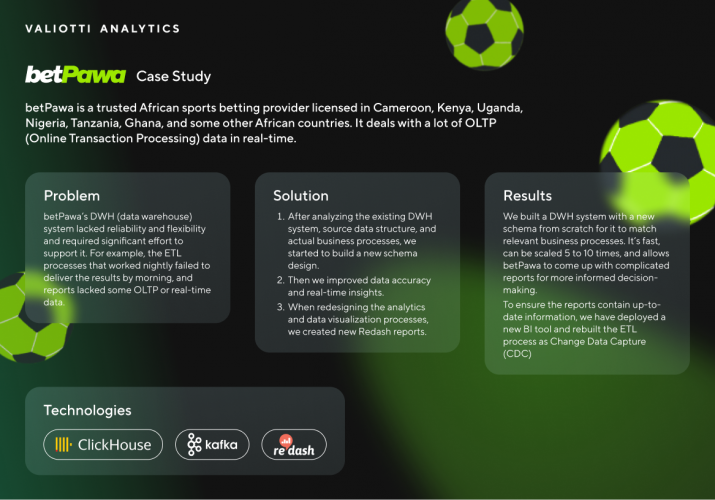
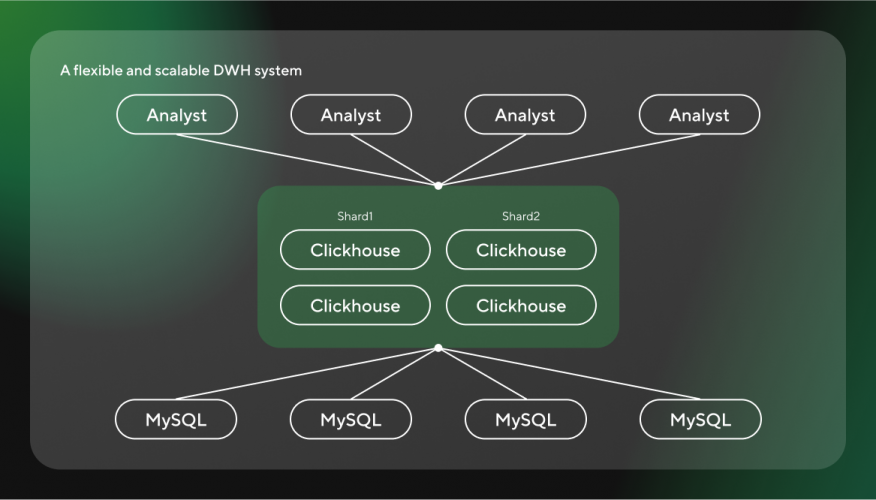
- Betpawa
Valiotti Analytics Reviews
- All Services
- Big Data & BI
- Relevance
- Most Recent
- Rating: high to low
- Rating: low to high

Exceptional Support for Business Intelligence Dashboard Setup.
Review Summary
What was the project name that you have worked with Valiotti Analytics?
global crypto startup Worldcoin
What service was provided as part of the project?
Big Data & BI
Describe your project in brief
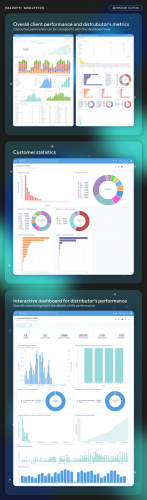
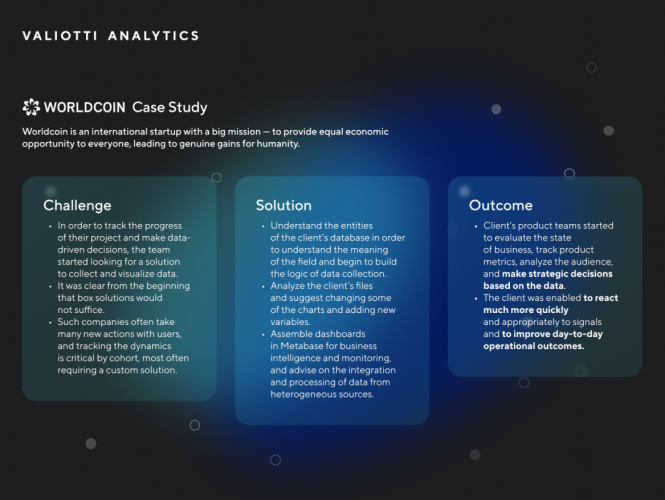
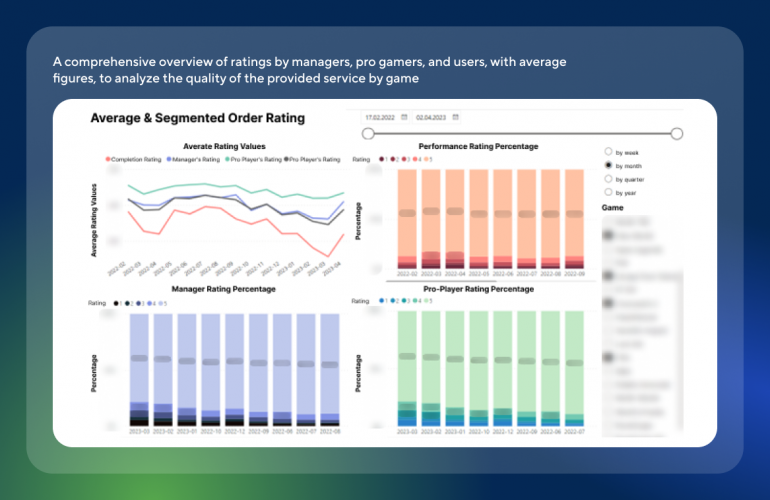
Valiotti Analytics integrated with the client's data science team to set up dashboards for business intelligence and monitoring, and advised on the integration and processing of data from heterogeneous sources.
What is it about the company that you appreciate the most?
We appreciate Valiotti Analytics' integration with our data science team, their robust approach to eliciting our requirements, and their ability to quickly deploy solutions.
What was it about the company that you didn't like which they should do better?
There were no areas of dissatisfaction; Valiotti Analytics has exceeded our expectations and we look forward to continuing working with them.
Valiotti Analytics: Exceptional Support for Data Warehouse Maintenance and Development.
Review Summary
What service was provided as part of the project?
IT Services
Describe your project in brief
Valiotti Analytics provided technical assistance in maintaining and developing the existing data warehouse for the client's company, serving as a strong support for their analytics department.
What is it about the company that you appreciate the most?
We appreciate the wonderful people and professionals at Valiotti Analytics. Their team's expertise and support have been invaluable to our project.
What was it about the company that you didn't like which they should do better?
There were no areas of dissatisfaction; Valiotti Analytics has exceeded our expectations and we look forward to further collaboration with them.
Outstanding Experience in Data Pipeline Development with Valiotti Analytics.
Review Summary
What service was provided as part of the project?
Software Development
Describe your project in brief
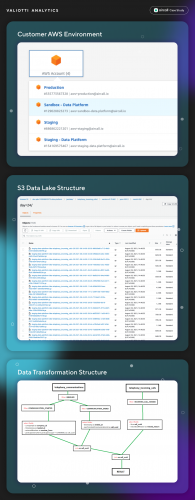
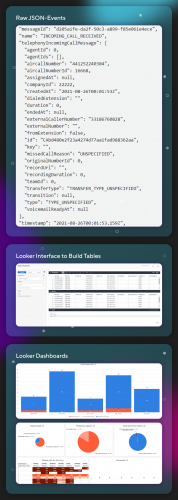
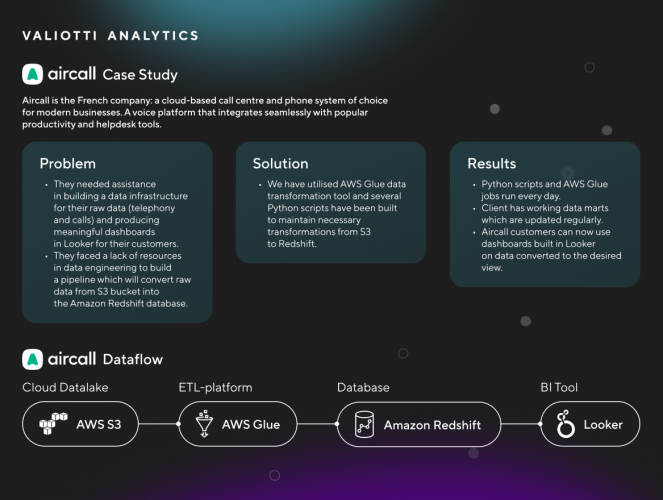
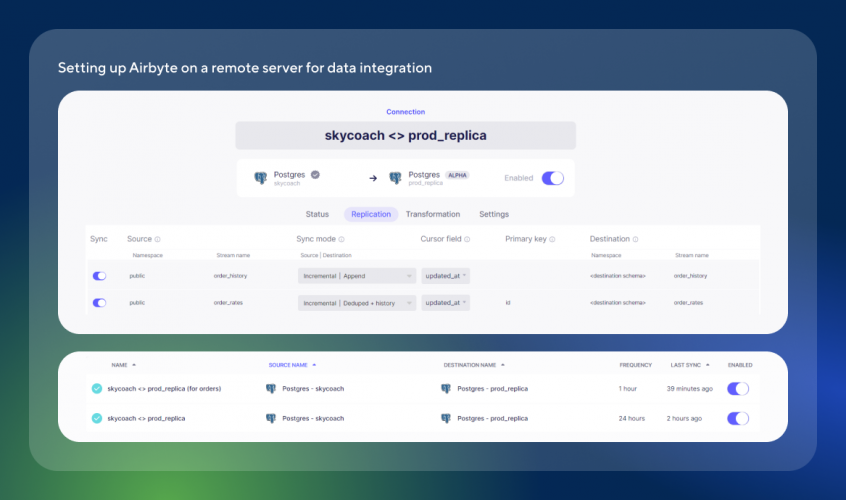
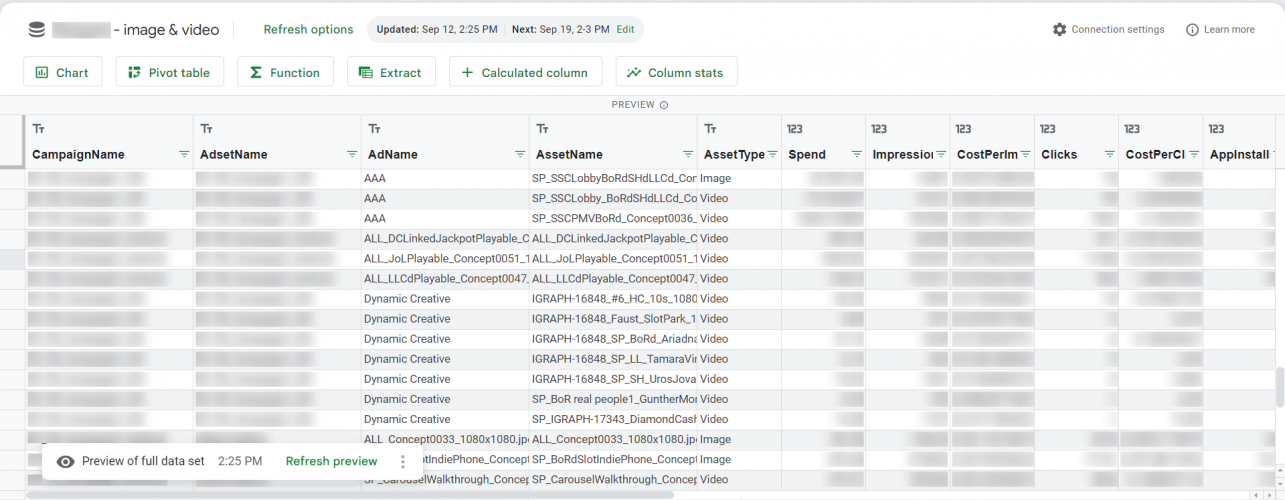
We needed top-tier professionals in data engineering with a deep understanding of cloud providers and cloud databases to build a customized data pipeline. Since we didn’t have in-house expertise, we sought a remote expert with extensive hands-on cloud data stack experience. We chose Valiotti Analytics due to their years of experience in setting up cloud databases and implementing data engineering solutions. Additionally, we wanted the raw data visualized in Looker to help our customers track telephony services and enhance the end-user experience.
What is it about the company that you appreciate the most?
I most appreciate Valiotti Analytics' deep understanding of cloud data stacks, their proactive problem-solving approach, and their dedication to delivering high-quality, customized solutions.
What was it about the company that you didn't like which they should do better?
There weren't any specific areas for improvement mentioned, as I was overall very satisfied with Valiotti Analytics' services.
They consistently went above and beyond our expectations.
Review Summary
What was the project name that you have worked with Valiotti Analytics?
Custom Software Development for IT Education Company
What service was provided as part of the project?
Big Data & BI
Describe your project in brief
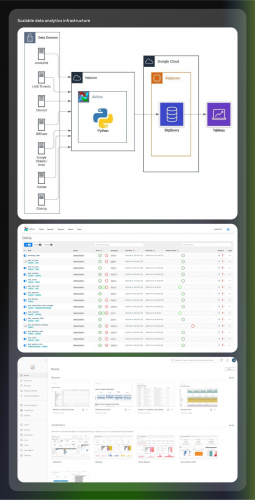
We hired Valiotti Analytics for custom software development services. They were responsible for building our digital analytics infrastructure from scratch.
What is it about the company that you appreciate the most?
Their proactive and results-oriented approach.
What was it about the company that you didn't like which they should do better?
None.

Very strong team, and a pleasure to work with
Review Summary
What was the project name that you have worked with Valiotti Analytics?
Data Engineering / Data Analysis
What service was provided as part of the project?
Big Data & BI
Describe your project in brief
Since about six months, Nikolay and his team are doing tremendous work for us. They’re sharp, professional, efficient, and excellent communicators. They managed to bring clarity in a very complex and chaotic environment, with a patient, yet ambitious pace. Nikolay is also very present when needed, but can rely on his strong team. I definetly recommend!
What is it about the company that you appreciate the most?
Great professionals, sharp efficient and great communicators
What was it about the company that you didn't like which they should do better?
N/A